
We recently hosted a technical webinar at Cleric to walk through why the current approach to AI in operations is failing. For the engineers who couldn’t make it, here’s the architectural shift we’re proposing.
The judgment bottleneck
AI coding tools have dramatically accelerated the development loop. Teams are shipping more code, more services, and more changes than ever before. But all of that code lands in the same place: production. And production hasn’t gotten any easier to operate.
What used to be a manageable graph of human-written services and their dependencies is now an explosion of AI-generated code interleaved with human code, multiplying the interactions and failure modes that need to be understood when something breaks. The development loop got faster. The production loop, the part where you figure out what went wrong and why, is still manual, high-latency, and increasingly overwhelmed.
Today, resolving production issues depends on pulling engineers into a Slack channel to act as a living database of system behavior. As one engineering leader told us: “We probably have 10 people at the same time working in their own streams looking at the issue.” Judgment is the bottleneck, and AI-assisted development is making the problem worse, not better.
Where current approaches fall short
When teams realize judgment is the bottleneck, they usually reach for one of three patterns.
AI features inside observability tools can tell you CPU spiked at 14:23. They can’t tell you that the deployment rollback at 14:19 triggered a connection pool drain that caused the spike. They only see the metrics you send them, typically blind to Kubernetes state, code changes, and Slack context.
Alerting and incident management systems automate the process around incidents: paging, Zoom bridges, status pages. They’re useful during a Sev0, but they don’t help with the sub-Sev1 issues that consume most on-call time. And they start every investigation from scratch.
General purpose agents can accumulate context and reason across it, but without understanding what normal looks like for a given system, they can’t distinguish signal from noise. They don’t maintain a world model of your environment, and they have no way to measure whether their conclusions were right or wrong. For checkout-service, a p99 latency spike means investigate database query patterns and connection pooling. For queue-processor, the same spike means check if you’re recovering from a Kafka partition rebalance. A Redis CPU spike gets escalated when your team knows it’s expected during backup windows. That judgment is specific to your environment.
All three patterns share the same gap: the cache eviction issue that took 4 hours to debug on Tuesday gets rediscovered on Friday because nothing persisted the diagnostic path.
How we built memory into the agent
Capturing expected behavior requires more than logging past alerts. You need to understand infrastructure topology and service dependencies, remember engineer corrections, and codify the specific investigation strategies your team uses. Those are three distinct problems, and they each need a different type of memory.
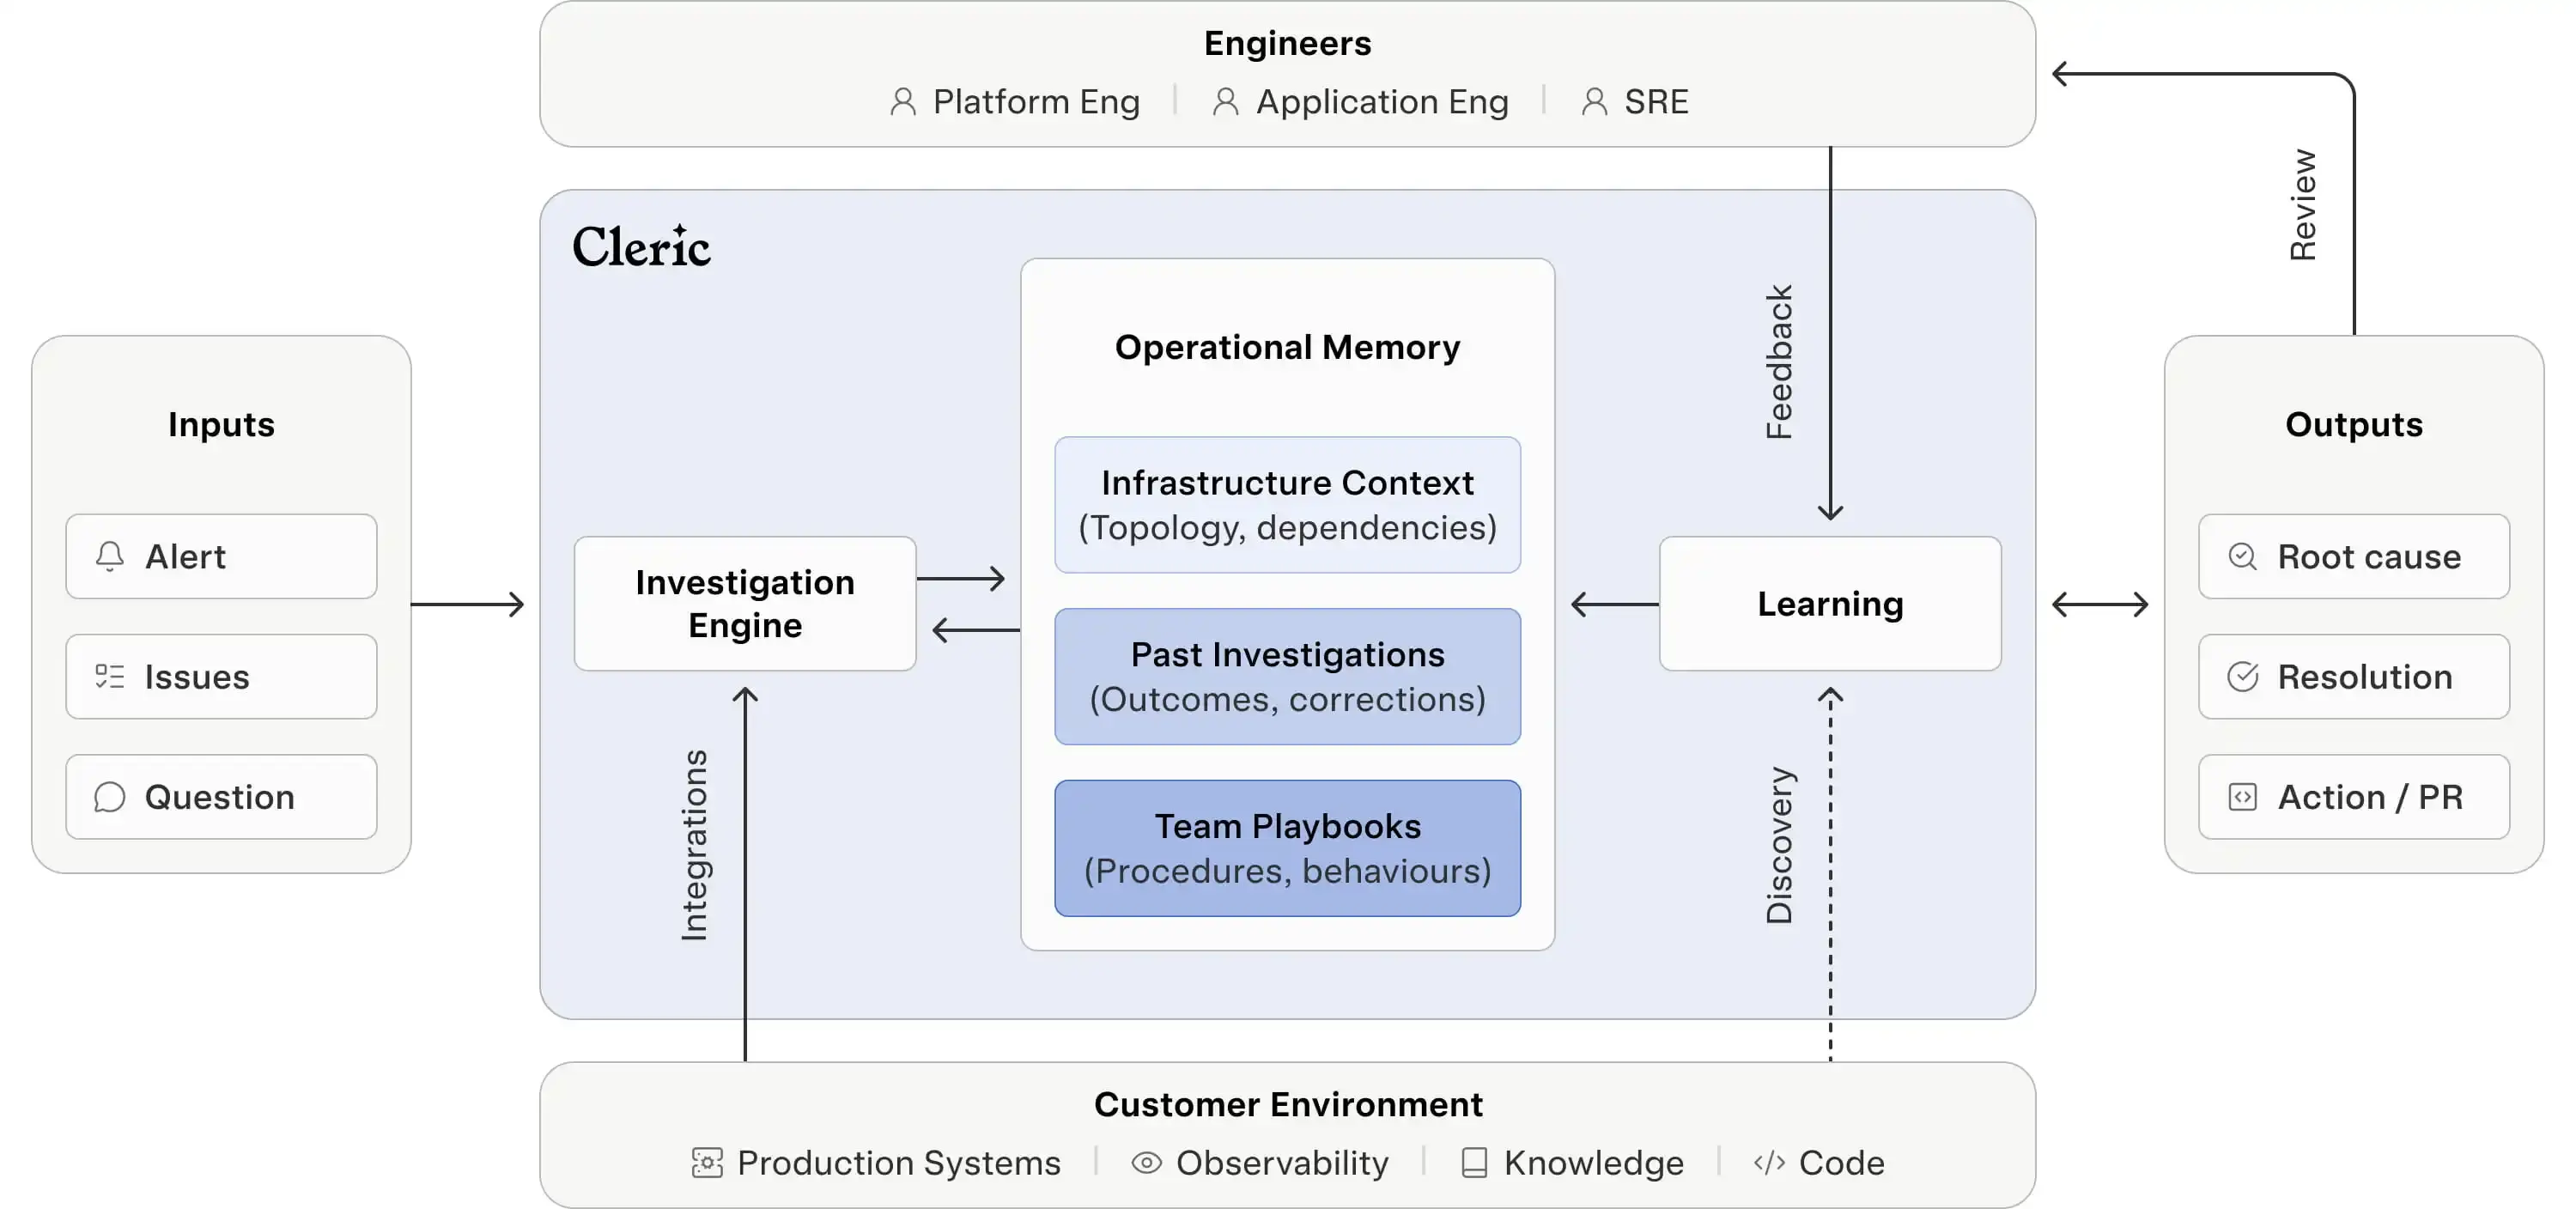
Semantic memory gives the agent a map of your infrastructure. It doesn’t just see “service-auth threw errors.” It sees that service-auth depends on Redis cluster-7, which was migrated last Tuesday, and that the connection string config changed in PR #847. This map isn’t built reactively during investigations. The agent continuously maintains a world model of your environment, tracking changes to infrastructure, deployments, and dependencies as they happen.
Episodic memory captures what happened and what your team learned from it. When you tell Cleric, “this lag spike is expected during producer recovery,” that judgment gets encoded as a constraint on future investigations. The next time that pattern appears, Cleric checks episodic memory before paging anyone.
Procedural memory captures how your team actually debugs things. It learns that for memory alerts on your API pods, you always check for OOM kills before analyzing heap dumps. For latency spikes on background workers, you check queue depth first. It encodes the investigation strategies specific to your environment and services.
But knowing when a past pattern applies to a new situation and when it doesn’t is fundamentally harder. Infrastructure changes constantly: a memory about Redis cluster-7 becomes misleading after a migration. An investigation strategy that worked for one service can be wrong for another with similar symptoms. Stale or misapplied memory is worse than no memory at all, because the agent acts confidently on bad context. This is also why you need to measure investigation outcomes. When a memory leads to a faster resolution, it gets reinforced. When it leads the agent down a wrong path, it gets corrected or expired. Without that feedback loop, you can’t manage memory at all. This is why most teams that try to bolt memory onto an existing agent end up turning it off. Getting memory right means building retrieval, relevance, measurement, and expiration into the core architecture.
Fewer steps, faster identification
In our live demo, we ran the same investigation twice. On the first run, Cleric had no prior context: it worked through the full investigation path, querying metrics, correlating logs, and exploring multiple hypotheses across a long sequence of tool calls. On the second run, Cleric pulled in context from the earlier investigation. It still investigated, validating the current state, checking whether conditions had changed, but needed fewer steps to reach the same finding: 7 minutes instead of 11. That’s the difference between an agent that starts from scratch every time and one that compounds knowledge. And it extends beyond a single investigation. That context compounds, but only if it’s captured somewhere other than an individual engineer’s head.
Today, that knowledge is trapped in individuals, lost when people leave or rotate off on-call, and inaccessible at 2 am. As one engineer told us: “A lot of it is tribal knowledge… It’s all in their heads.” With operational memory, every correction, every “this is normal,” every debugging strategy persists in the system. Engineers still make the decisions; they just make them faster with better context.
Cross-service incidents also become more tractable. The ML team ships a model that increases API call volume, hits rate limits from capacity planning, and triggers cost alerts. Three alerts fire across three teams. Without memory, that’s three separate investigations. With memory, the system connects the events, identifies the model deployment as the root cause, and surfaces one incident instead of three.
What compounds and what doesn’t
Investigation logic will commoditize. Every AI tool will eventually be able to query metrics and parse logs. You could argue that foundation models with long context windows will get good enough to derive expected behavior from code and documentation alone. But the difference between “this Redis spike is a problem” and “this Redis spike happens every night during the backup window” lives in operational experience, not documentation. Production environments are idiosyncratic in ways that are hard to extract from static sources, and that knowledge doesn’t transfer across companies. Regardless of where you land on that, the question is the same: after 100 alerts, is your AI dramatically better than it was at alert 1? If the answer is no, something fundamental is missing.